ANCIENT RUSSIAN INFOGRAPHICS

Boring tables and graphics in interesting form

Peasantry and Servicing Class
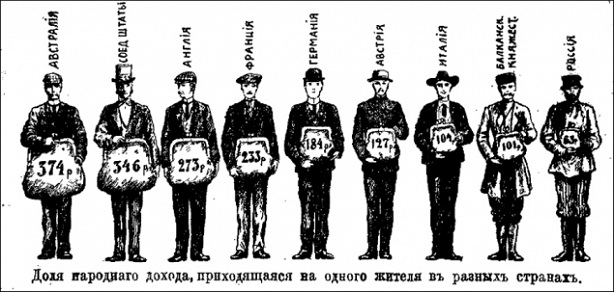
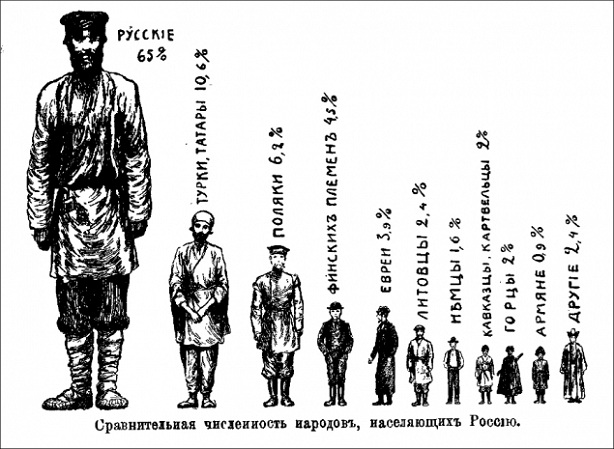
(Russians; Turks, Tartars; Polish; Finn tribes; Hebrews; Lithonia’s; Germans; Caucasian, Cartesians; Highlanders; Armenians; other nationals)

Comparative number of estates in a thousand souls
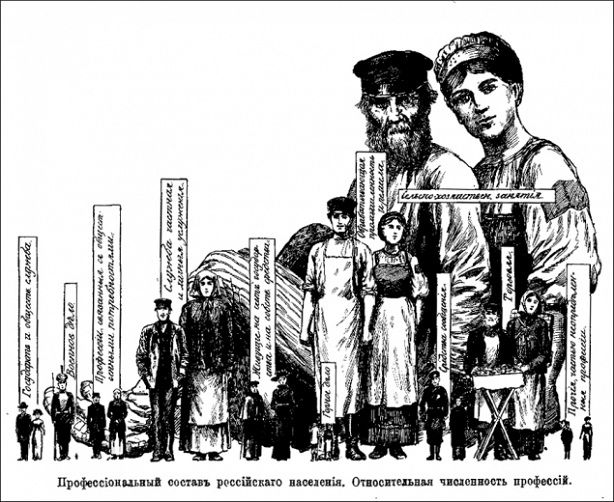
(Government and public service; Armed Forces; professions related to public requirements; private and personal servicing; those, supported by government and self-employed; mining; transportation; trading; other private business; agriculture)
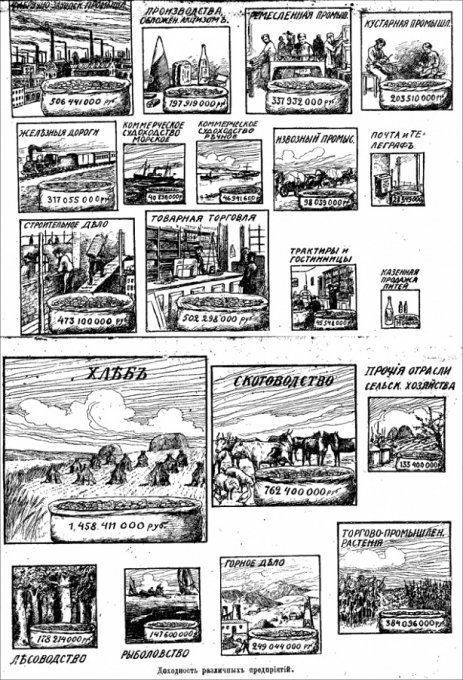
Profitability of different enterprises in the empire (Wheat; Cattle breeding; Other agriculture industries, Forestry, Fishing, Mining, Trade and Industrial Plants)

A week-long food basket of the English three-members-family laborer with 450Rubles/year budget and a three-members-family mechanic from Nizhny Novgorod with 400Rubles/year to live on (tea, butter, oil, sugar, meat and fat, potatoes, 12 kopecks worth vegetables, white wheat and bread, brown bread)
Читайте наши статьи на Дзен

